Monitoring Spinnaker with Prometheus
Warning
There is a known issue with metric names in version 2.20.x. Until this issue is resolved, any dashboards created from the instructions on this page will not work. For more information, see the release notes for your version, such as 2.20.5.Overview
Armory recommends using a monitoring solution to confirm the health of Spinnaker for every production instance. This document describes how to set up a basic Prometheus and Grafana stack along with enabling monitoring sidecars for the Spinnaker microservices. These sidecar pods provide a metrics endpoint that Prometheus reads and Grafana graphs. Additional Prometheus and Grafana configuration is necessary to make them production-grade, and this configuration is not a part of this document.
Assumptions
- You are familiar with Prometheus and Grafana
- Spinnaker is deployed in the spinnaker-system namespace
- Prometheus and Grafana are (or will be) deployed in the monitoring namespace
Use kube-prometheus to create a monitoring stack
You can skip this section if you already have a monitoring stack.
A quick and easy way to configure a cluster monitoring solution is to use kube-prometheus. This project creates a monitoring stack that includes cluster monitoring with Prometheus and dashboards with Grafana.
To create the stack, follow the kube-prometheus quick start instructions beginning with the Compatibility Matrix section.
After you complete the instructions, you have pods running in the monitoring namespace.
% kubectl get pods --namespace monitoring

NAME                                  READY   STATUS    RESTARTS   AGE
alertmanager-main-0                   2/2     Running   0          44s
alertmanager-main-1                   2/2     Running   0          44s
alertmanager-main-2                   2/2     Running   0          44s
grafana-77978cbbdc-x5rsq              1/1     Running   0          40s
kube-state-metrics-7f6d7b46b4-crzx2   3/3     Running   0          40s
node-exporter-nrc88                   2/2     Running   0          41s
prometheus-adapter-68698bc948-bl7p8   1/1     Running   0          40s
prometheus-k8s-0                      3/3     Running   1          39s
prometheus-k8s-1                      3/3     Running   1          39s
prometheus-operator-6685db5c6-qfpbj   1/1     Running   0          106s
Access the Prometheus web interface by using the kubectl port-forward command. NOTE: if you want to expose this interface for others to use, create an ingress service. Before doing that, enable security controls following Prometheus best practices.
% kubectl --namespace monitoring port-forward svc/prometheus-k8s 9090 &
Navigate to http://localhost:9090/targets.
Configure monitoring in Spinnaker
To enable monitoring of Spinnaker by Prometheus, enable the metric-stores configuration.
Halyard
Issue these halyard commands from within your hal directory or within your halyard container:
halyard-0:~ $ hal config metric-stores prometheus enable

+ Get current deployment
  Success
+ Edit prometheus metric store
  Success
+ Successfully enabled prometheus

halyard-0:~ $ hal deploy apply
Operator
  apiVersion: spinnaker.armory.io/v1alpha2
  kind: SpinnakerService
  metadata:
    name: spinnaker
  spec:
    spinnakerConfig:
      config:
        metricStores:
          prometheus:
            enabled: true
            add_source_metalabels: true
Wait for all of the Spinnaker pods to be ready before proceeding to the next step. You can check the status by running the kubectl get pods command. Because you are adding a sidecar to each pod, you may need to ensure you have enough capacity in your Kubernetes cluster to be able to support the additional resource requirements.
Configure Prometheus to monitor Spinnaker
There are two steps to configure Prometheus to monitor Spinnaker:
- Add permissions for Prometheus to talk to the Spinnaker namespace
- Configure Prometheus to find the Spinnaker endpoints
Add permissions for Prometheus by applying the following configuration to your cluster:
apiVersion: rbac.authorization.k8s.io/v1
kind: Role
metadata:
  name: prometheus-k8s
  namespace: spinnaker-system
rules:
- apiGroups:
  - ""
  resources:
  - services
  - endpoints
  - pods
  verbs:
  - get
  - list
  - watch
---
apiVersion: rbac.authorization.k8s.io/v1
kind: RoleBinding
metadata:
  name: prometheus-k8s
  namespace: spinnaker-system
roleRef:
  apiGroup: rbac.authorization.k8s.io
  kind: Role
  name: prometheus-k8s
subjects:
- kind: ServiceAccount
  name: prometheus-k8s
  namespace: monitoring
Configure Prometheus to find the Spinnaker metrics endpoints by applying this to your spinnaker-system namespace:
apiVersion: monitoring.coreos.com/v1
kind: ServiceMonitor
metadata:
  name: spinnaker-all-metrics
  labels:
    app: spin
    # this label is here to match the prometheus operator serviceMonitorSelector attribute
    # prometheus.prometheusSpec.serviceMonitorSelector
    # https://github.com/helm/charts/tree/master/stable/prometheus-operator
    release: prometheus-operator
spec:
  selector:
    matchLabels:
      app: spin
    namespaceSelector:
      any: true
  endpoints:
  # "port" is string only. "targetPort" is integer or string.
  - targetPort: 8008
    interval: 10s
    path: "/prometheus_metrics"
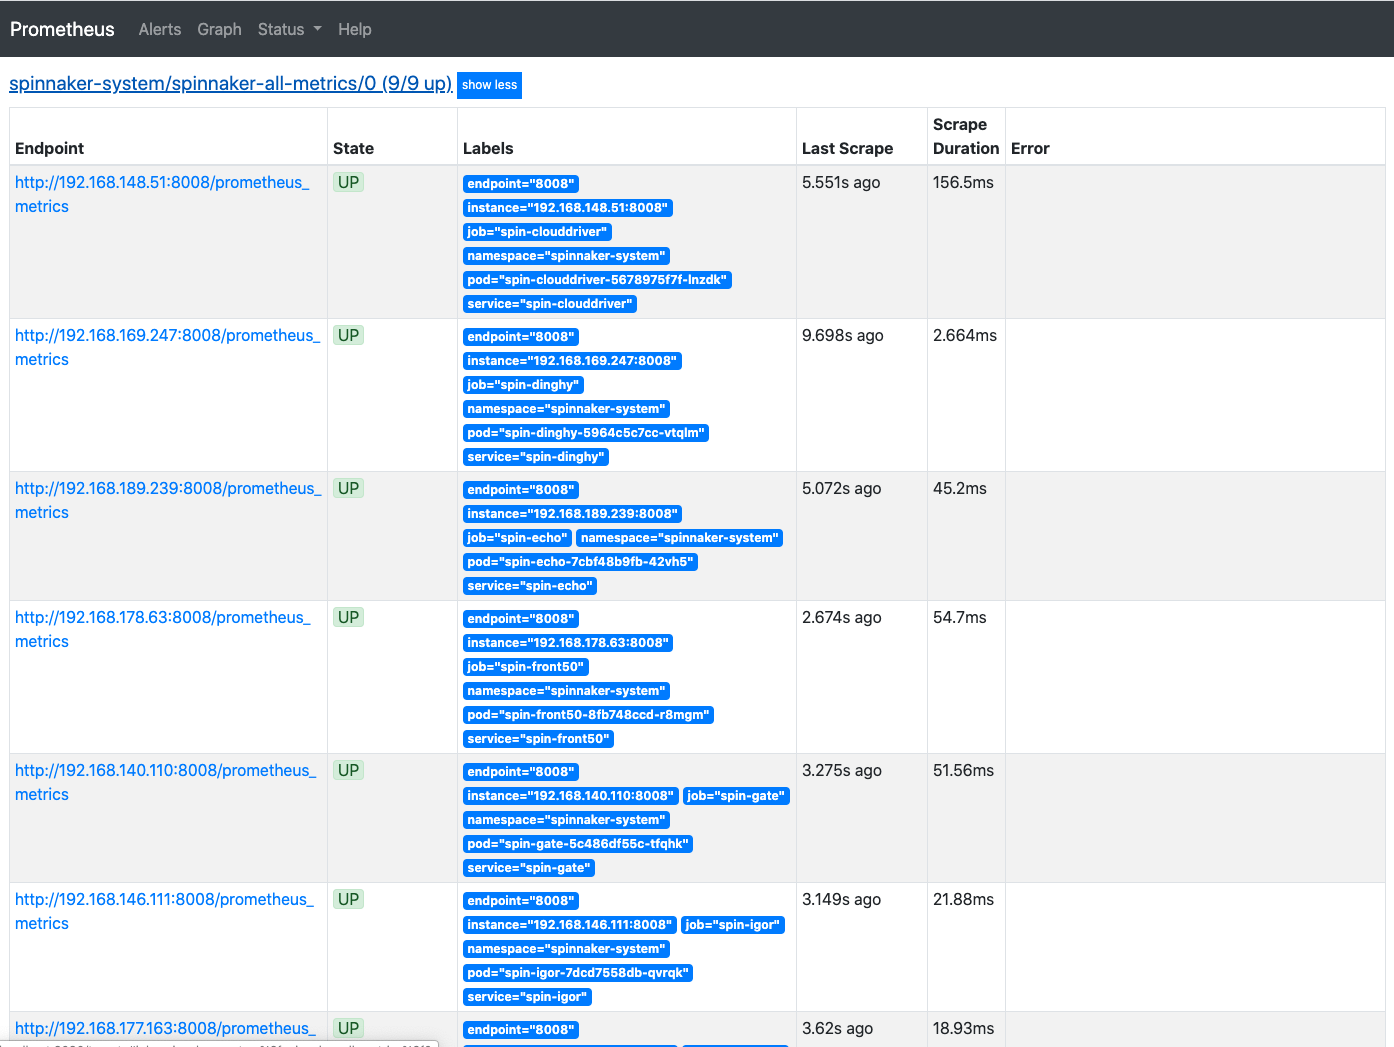
Check for Spinnaker targets in Prometheus
After applying these changes, you should be able to see Spinnaker targets in Prometheus. It may take 3 to 5 minutes for this to show up depending on where Prometheus is in its config polling interval.
Access Grafana
Configure port forwarding for Grafana:
$ kubectl --namespace monitoring port-forward svc/grafana 3000
Access the Grafana web interface via http://localhost:3000 and use the default grafana user:password of admin:admin.
Add Armory dashboards to Grafana
Armory provides some sample dashboards (in JSON format) that you can import into Grafana as a starting point for metrics to graph for monitoring. Armory has additional dashboards that are availabe to Armory customers. You can skip this section if you are a Grafana expert.
To import the sample dashboards, perform the following steps:
- Git clone this repo to your local workstation: (https://github.com/spinnaker/spinnaker-monitoring)
- Access the Grafana web interface (as shown above)
- Navigate to Dashboards then Manage
- Click on the Import button
- Upload the one or more of the sample dashboard files from the repo you cloned
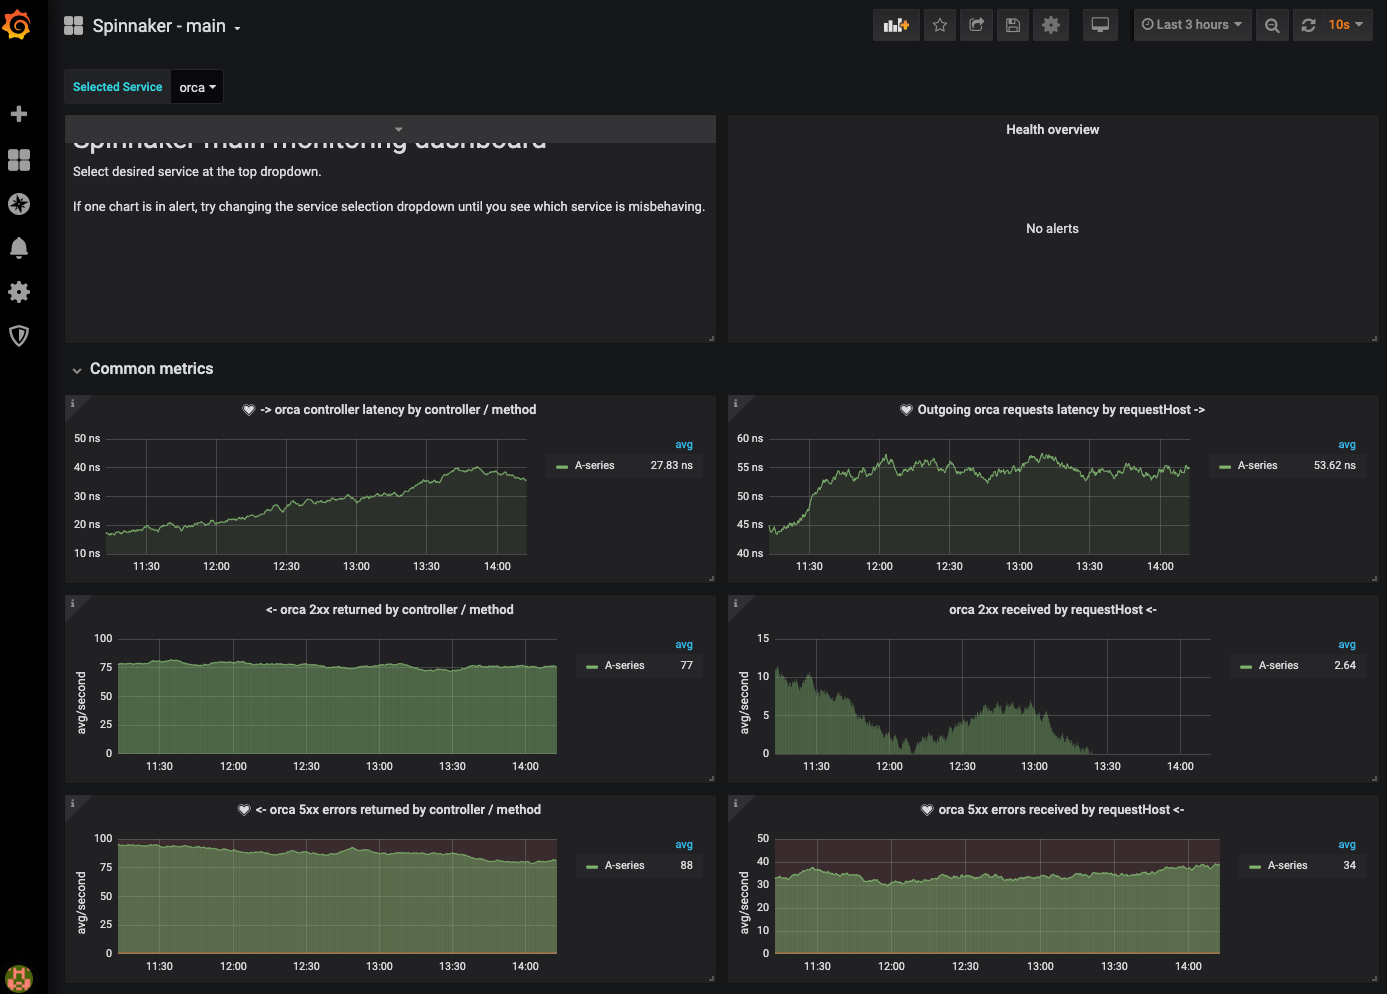
After importing the dashboards, you can explore graphs for each service by clicking on Dashboards, Manage, and then Spinnaker-main.
Feedback
Was this page helpful?
Glad to hear it! Please tell us how we can improve.
Sorry to hear that. Please tell us how we can improve.